| |

|
|
Profit & Loss Statement
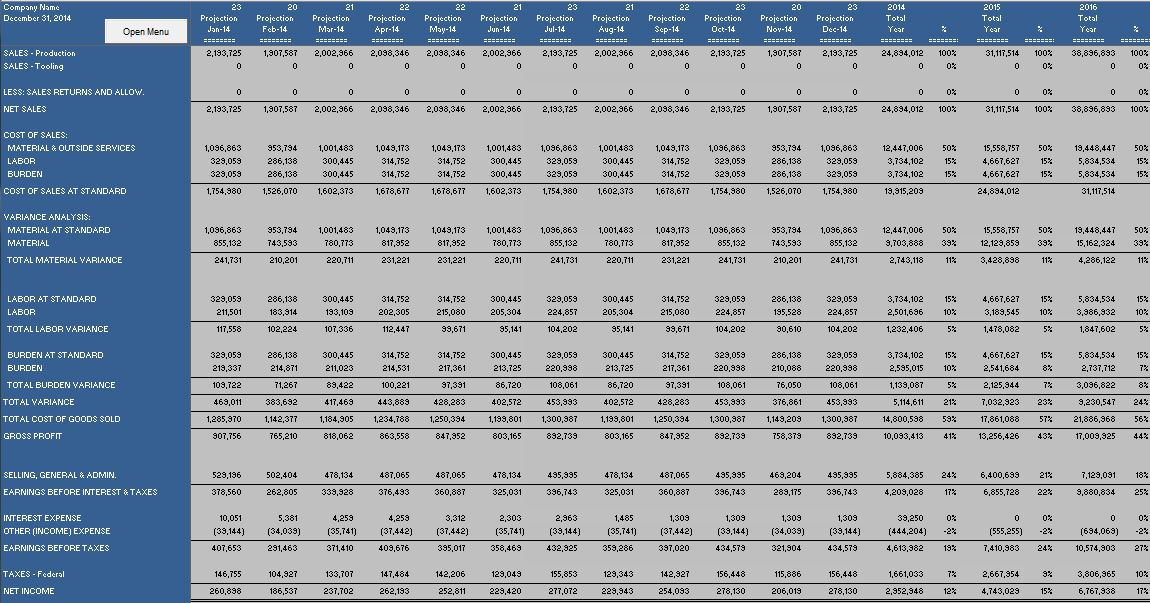
- Easy to read summary income statement.
- Financial statements are presented on a monthly and annual basis.
- Currently supports five presentation formats, maufacturing, retail, service, distribution and contracting.
- Summary statment includes two additional years annual results.
- Projection supports any monthly year end.
- .
Supporting Expense Schedules
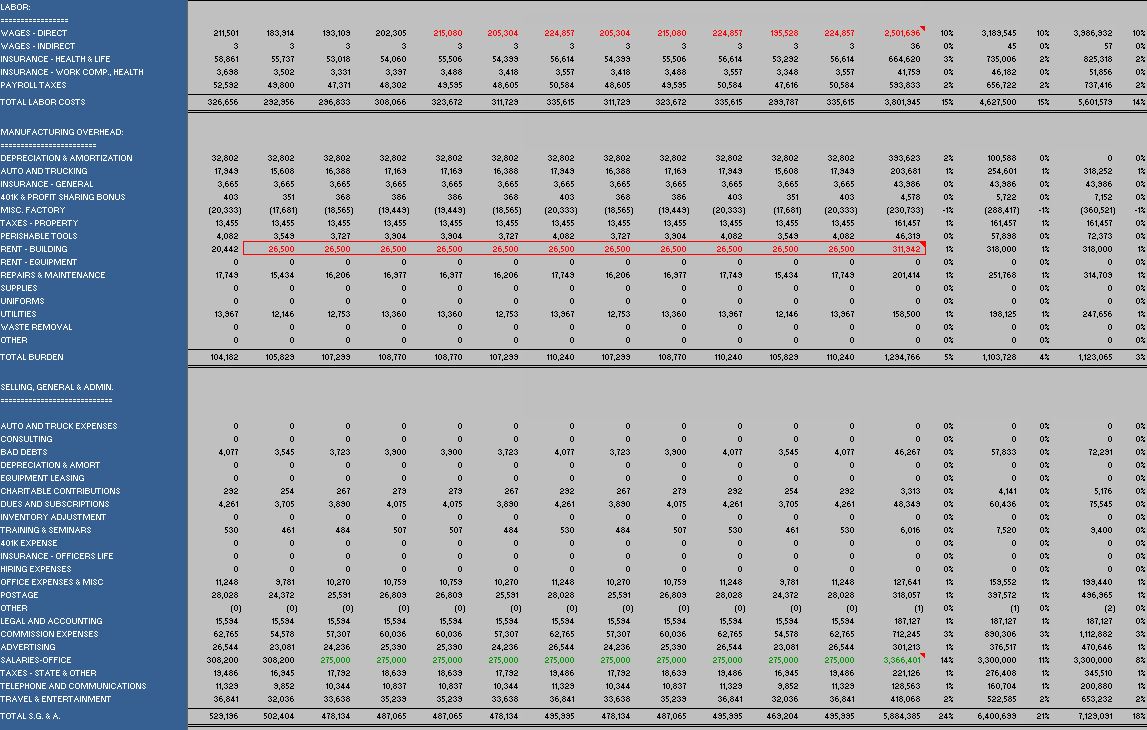
- Easily review detail that rolls up into the summary statment.
- Modifications to the baseline projection are color coded. Red indicates a negative impact on earnings, green has a positive impact.
- Modifications require narrative support for all changes.
Cash Flow Statement
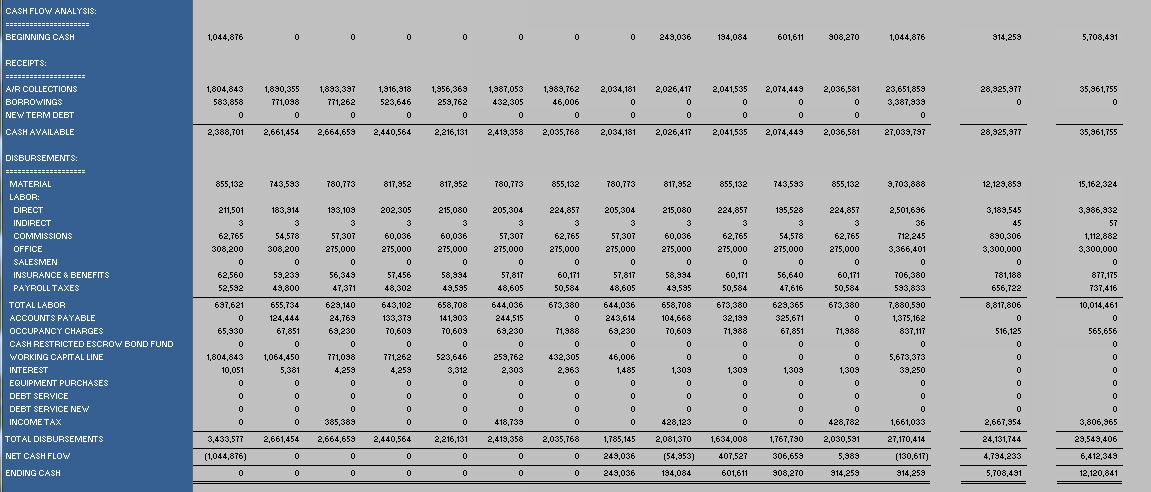
- Cash Flow format reflects a real world presentation.
- Excess cash flow pays down the line of credit (if it exits).
- Easily review the impact on cash for modifications to days outstanding in receivables and payables as well as inventory.
Balance Sheet
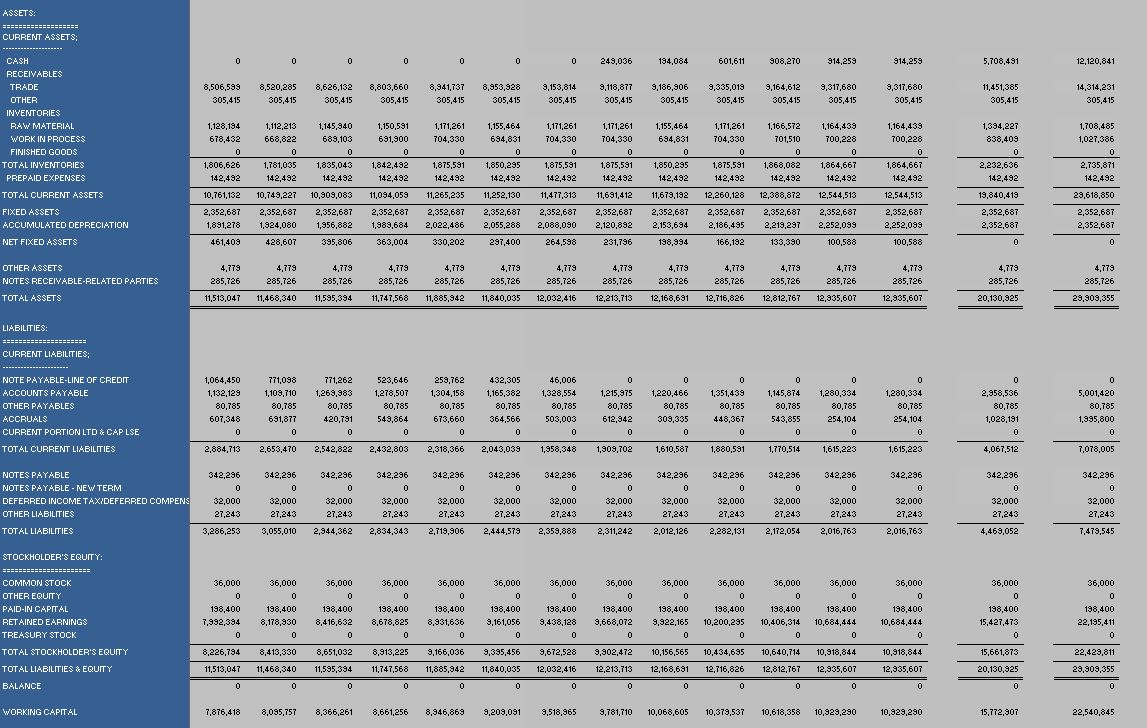
- Quickly assess inventory, receivable and payables on a monthly basis.
Borrowing Base Analysis
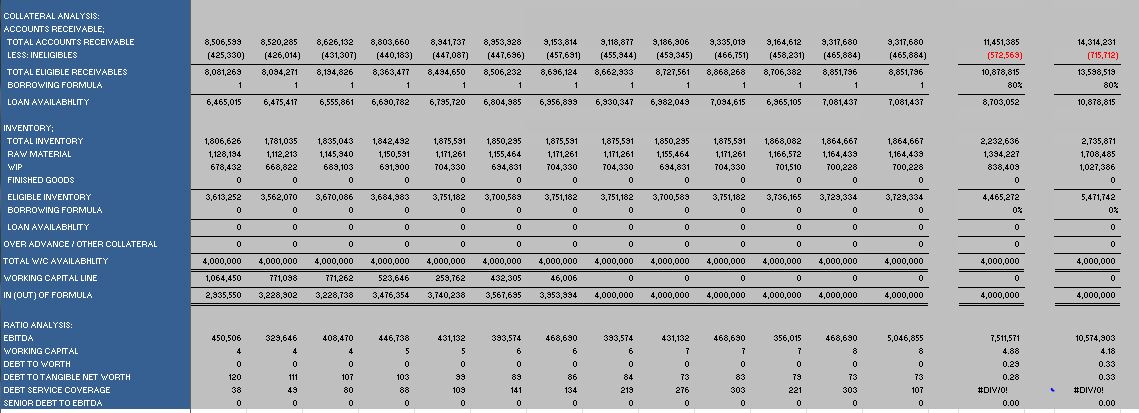
- Presentation shows all line of credit activity.
- User can alter ineligibles for taint, foreign and days outstanding bank rules.
- Addresses potential line cap issues.
- Measure seasonable needs for working capital.
Collateral Analysis
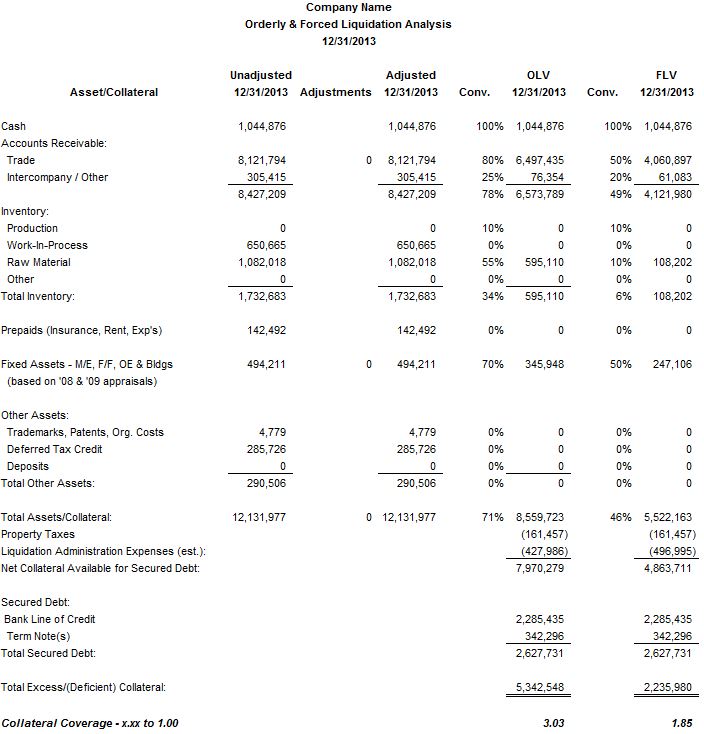
- Presentation incorporates orderly and forced values.
- Each balance sheet item has a variability control.
Business Valuation
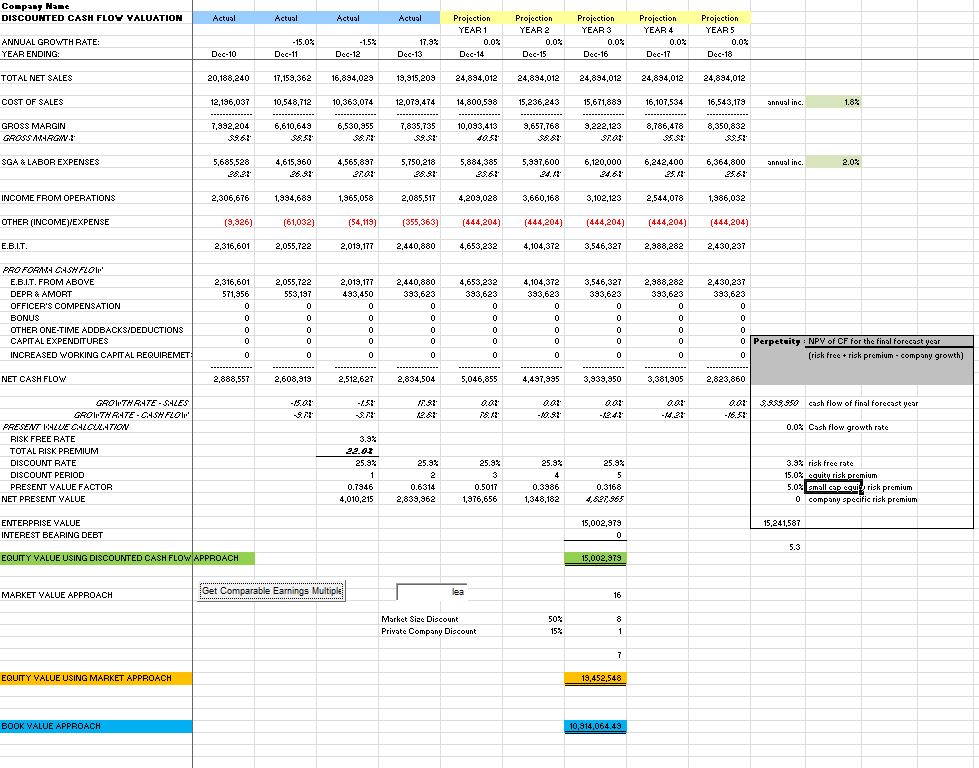
- Valuation report includes Book Value, Market Value and Discounted Cash Flow approaches.
13 Week Cash Flow
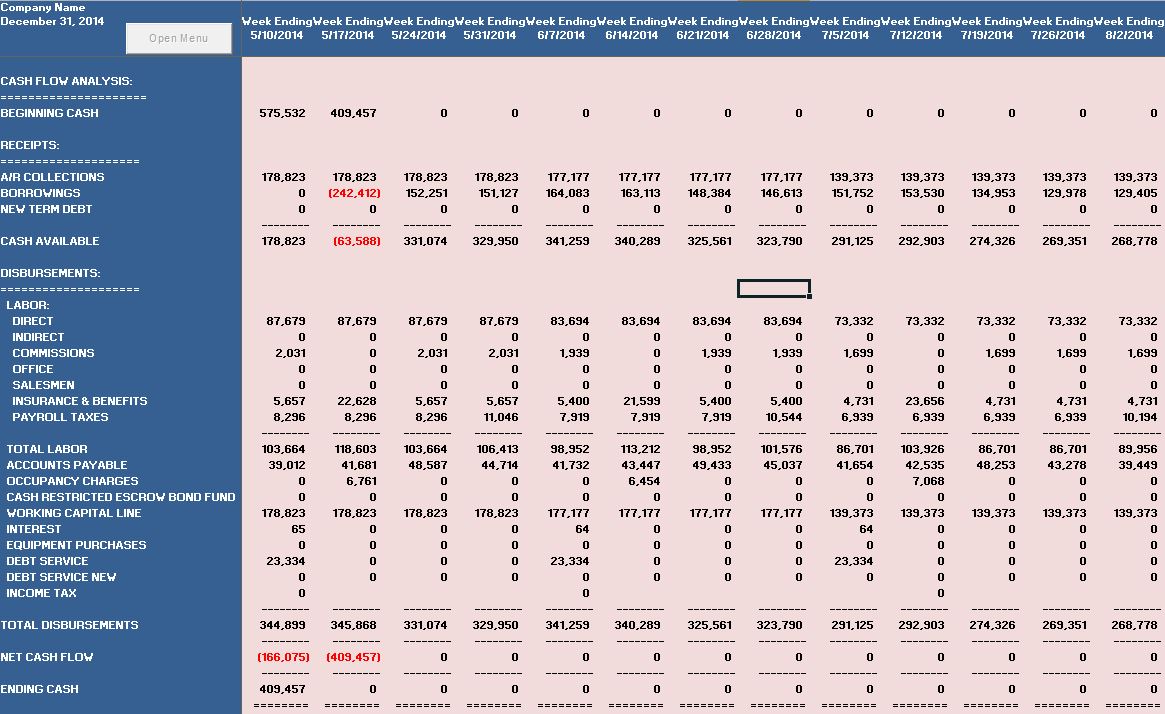
- Drills down on sources and uses of cash on a weekly basis.
Budget vs. Actual Results
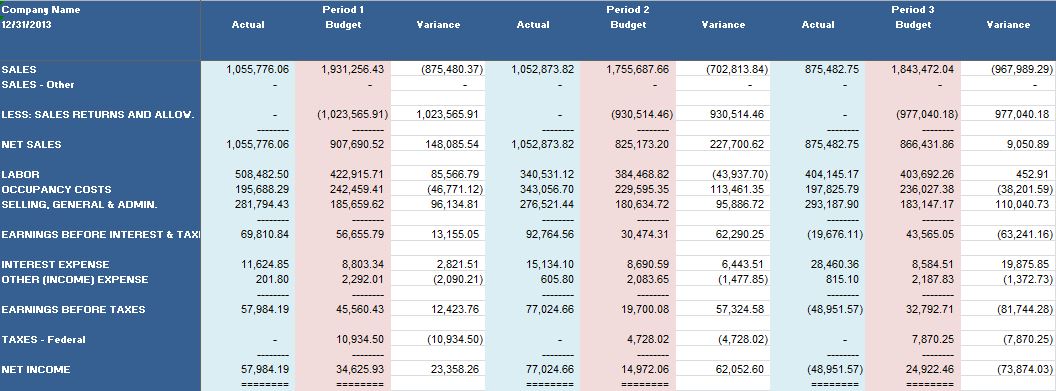
- Overlays actual results for perpetual projection.
Ratio Analysis
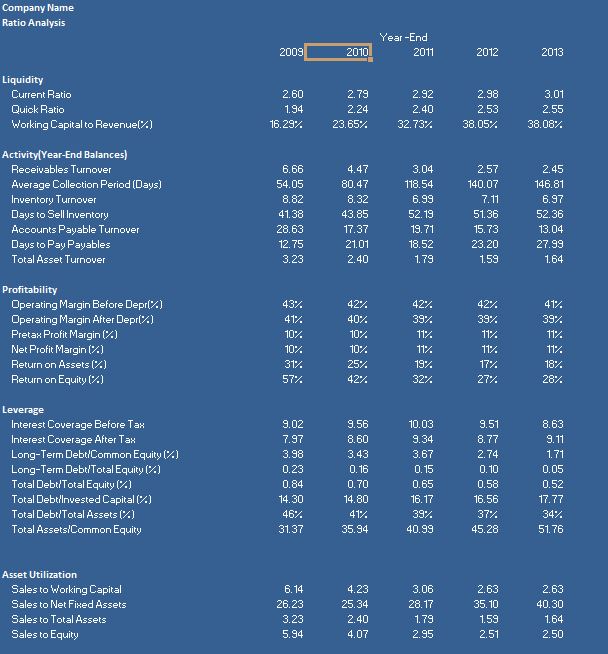
- Allows for visual trend assesments.
- Provides for comparison to publicly traded peer.
Revised Projection with Actual Results
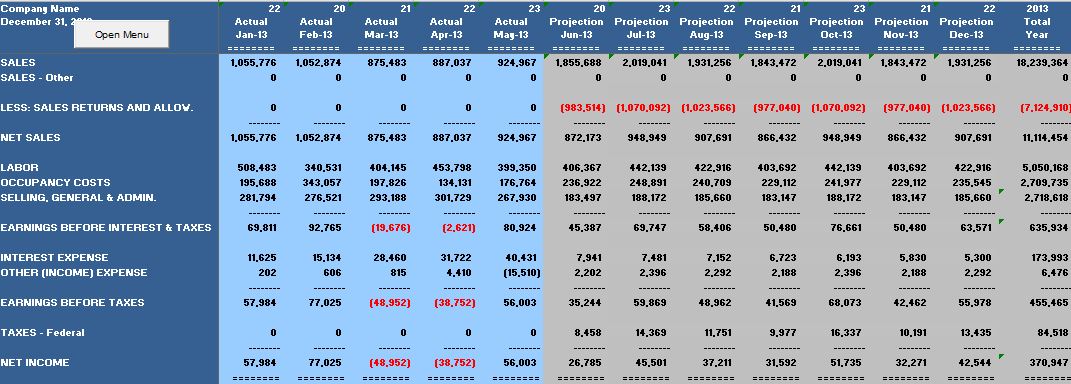
- Easily compare budget versus actual results for every line item in the projection.
- Each period update provides for monthly and year-to-date comparison.
- Actual updates recalibrate the projection so it always reflects the most plausable year end outcome.
Five Year Historical Financial Statements
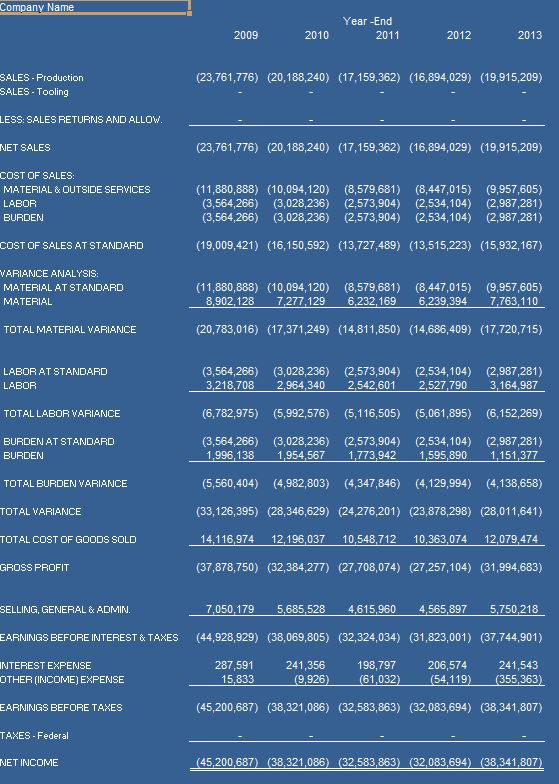
- Excellent presentation of historical perfromance.
- An integeral companent of any bank refinancing.
Graphics
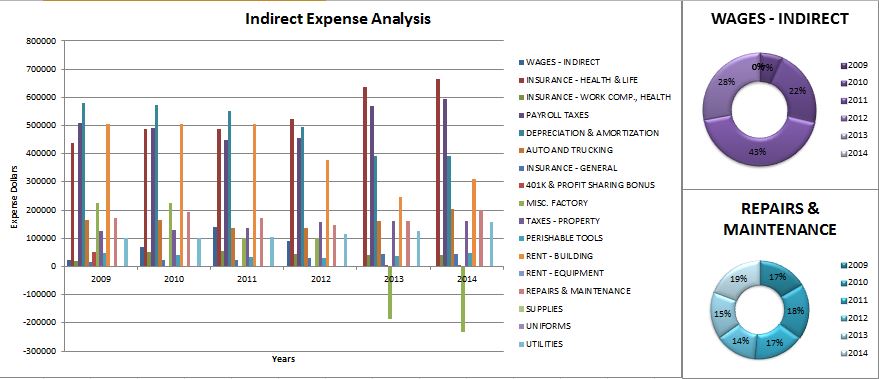
- Grephis presentation of projection data.
- Drill down into individual expense items for visual effect.